Crystallographic Orientation Maps Obtained from Ion and Backscattered Electron Channeling Contrast.
Clément LAFOND1, Cyril LANGLOIS1, Thierry DOUILLARD1, Sébastien DUBAIL2, Sophie CAZOTTES1
1. MATEIS laboratory – INSA Lyon, Lyon, France.
2. Axon Square Ltd, Sciez, France.
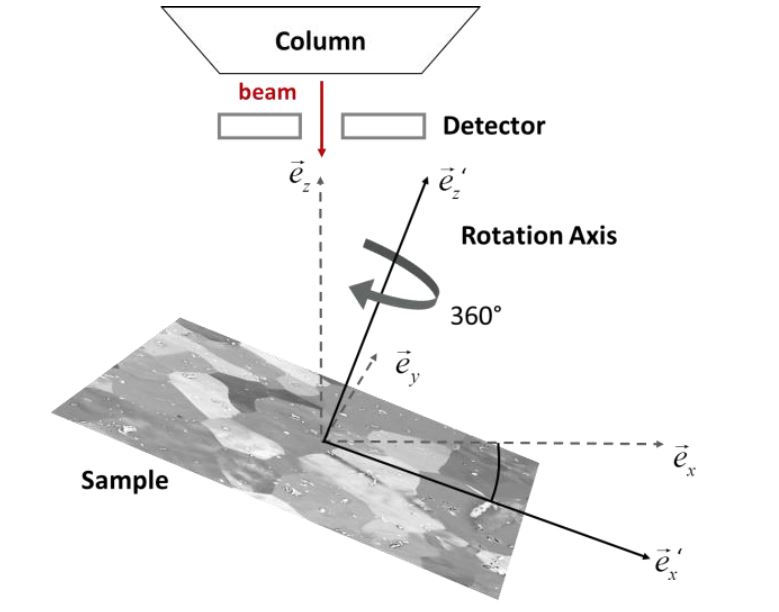
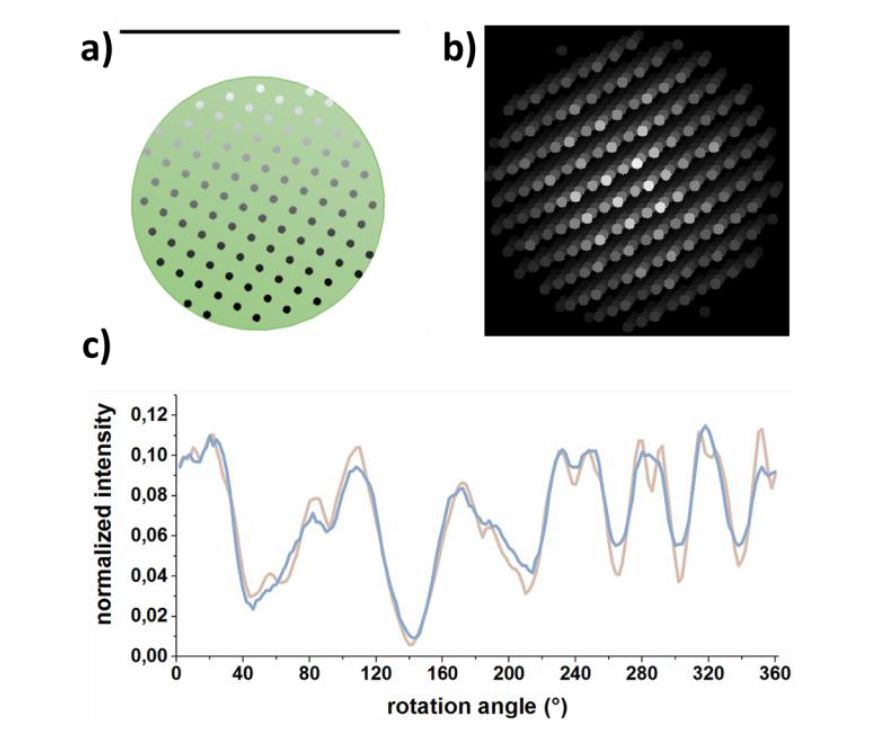
For several years now, new directions have been explored to obtain orientation maps by other means than the classical Electron Back Scattered Diffraction (EBSD) method, or to modify it aiming at improved information. Particularly, the channeling contrast may be used to obtain orientation maps, with the following approach, called Channeling Orientation Determination (CHORD) [1,2]. The main idea is to acquire an electron or ion image series when rotating a pre-inclined polycrystalline sample with respect to the beam (Figure 1). Along such image series, each (X,Y) pixel of the region of interest undergoes an intensity variation due to the channeling effect, that can be plotted as a function of the rotation angle. Such intensity profiles can be theoretical predicted for a given orientation of a crystal. The indexation procedure then relies on a search in a database of theoretical profiles obtained by simulating intensity profiles for a large set of orientations. The principal issue is to model quantitatively the channeling effect observed in such image series.Concerning ion-induced electron images (iCHORD image series), an intensity loss is observed when the ion beam arrives parallel to some low index crystallographic planes of a crystal. Therefore, if the atomic structure of the crystal is projected onto a surface perpendicular to the ion beam, an intensity loss will corresponds to large “free spaces” between the atomic projections, which are quantified by summing the grey levels of the projection pixels. An efficient model of the channeling effect is then obtained following this principle (Figure 2) provided precautions to avoid projection artefacts.
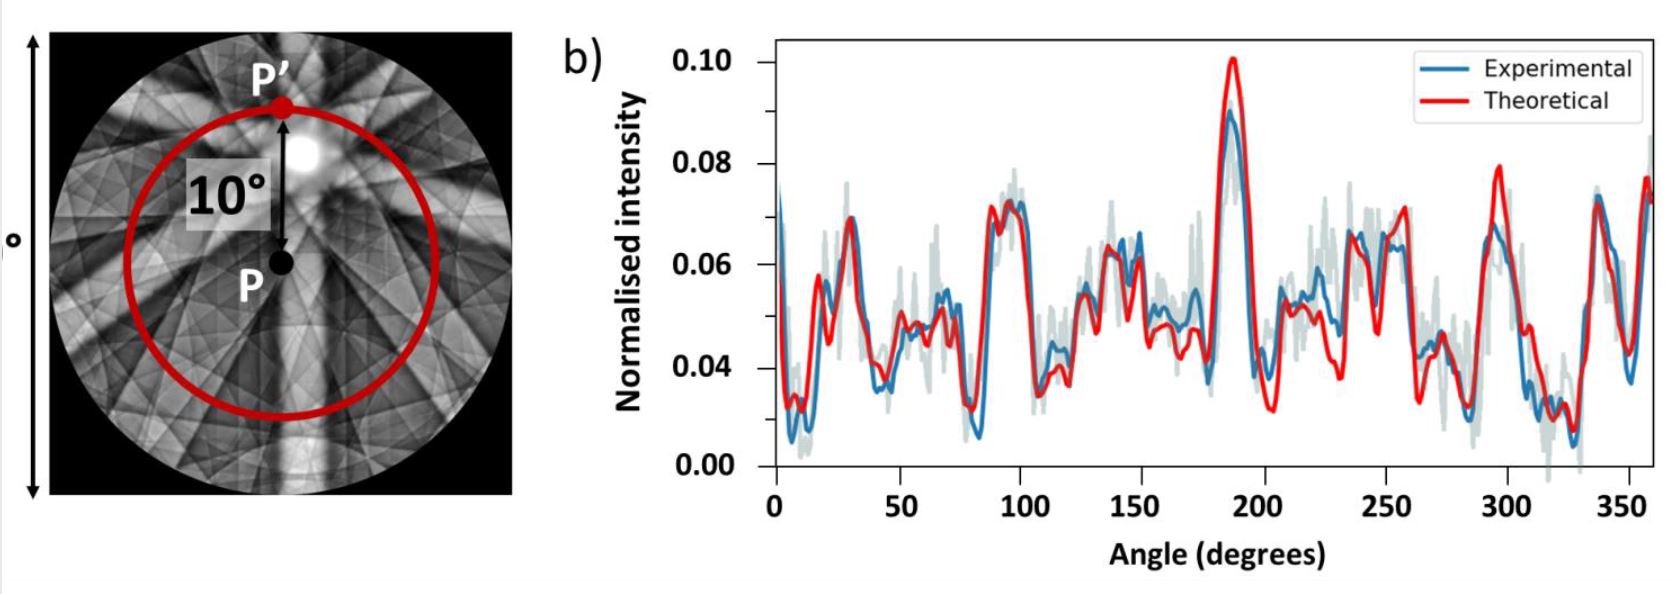
For back scattered electron image series, the similarity between the eCHORD and Electron Channeling Patterns (ECP) acquisitions is used to model quantitatively the experimental electron channeling effect. The eCHORD intensity profiles are then simulated by extracting the intensity along a circle from simulated ECPs (Figure 3) [3].
In the resulting orientation maps, the angular resolutions are both under 1°, with slightly better performances using electrons (around 0.3°) compared to ions (0.8°). More generally, the main advantage is that no extra detector is needed to carry out the experiment, opening orientation mapping capability potentially on any SEM and FIB machine. Moreover, acquisition times are comparable to EBSD technique. The geometry of acquisition, simpler than the EBSD one, could be also a critical advantage when turning to 3D orientation mapping.
Figure 1. Experimental CHORD setup
.
Figure 2. a) Atomic brightness function as a function of the distance toward the projection plane (black line on
the top); b) Projection plane on which atoms are projected c) Concordance between experimental (blue) and
theoretical (brown) intensity profiles.
Figure 3. a) ECP simulated at 15 kV for aluminum: in red, circle corresponding to the beam path at 10°;
b) comparison between the theoretical profile extracted from the ECP in (a) and the experimental profile after denoising.
Références:
[1] C. Langlois et al., Ultramicroscopy 157 (2015), p. 65
[2] C. Lafond et al., Ultramicroscopy 186 (2018), p. 146
[3] S. Singh and M. De Graef, Microscopy & Microanalysis, 23 (2017), p. 1